Showcase Demos
73 Gbit/s FFT signal payload. 50 Gbit/s market data throughput. Pure Python. MacBook Air M2.
No C extensions. No Cython. Just multiprocessing.shared_memory and PYTHUSA.
These two demos push PYTHUSA to its limits and show what a pure-Python shared-memory pipeline can do when the transport layer gets out of the way. Both include an interactive ImGui operator desk and a headless benchmarking mode that strips the GUI to measure raw throughput.
All commands below assume you are in the pythusa/ project root with the package installed (pip install -e ".[examples]").
FFT Pipeline Demo
~73 Gbit/s sustained FFT signal payload. ~140,000 FFT/s across 49 signals. Pure Python.
A multi-channel FFT pipeline that streams synthetic sensor data through shared-memory ring buffers into parallel FFT workers. The default 2-generator configuration hits ~21 Gbit/s at around 30% CPU utilization -- leaving massive headroom. Crank it to 7 generators and the pipeline delivers 73 Gbit/s of FFT input payload, enough to service roughly 17,000 NI USB-6423-class DAQ channels simultaneously.
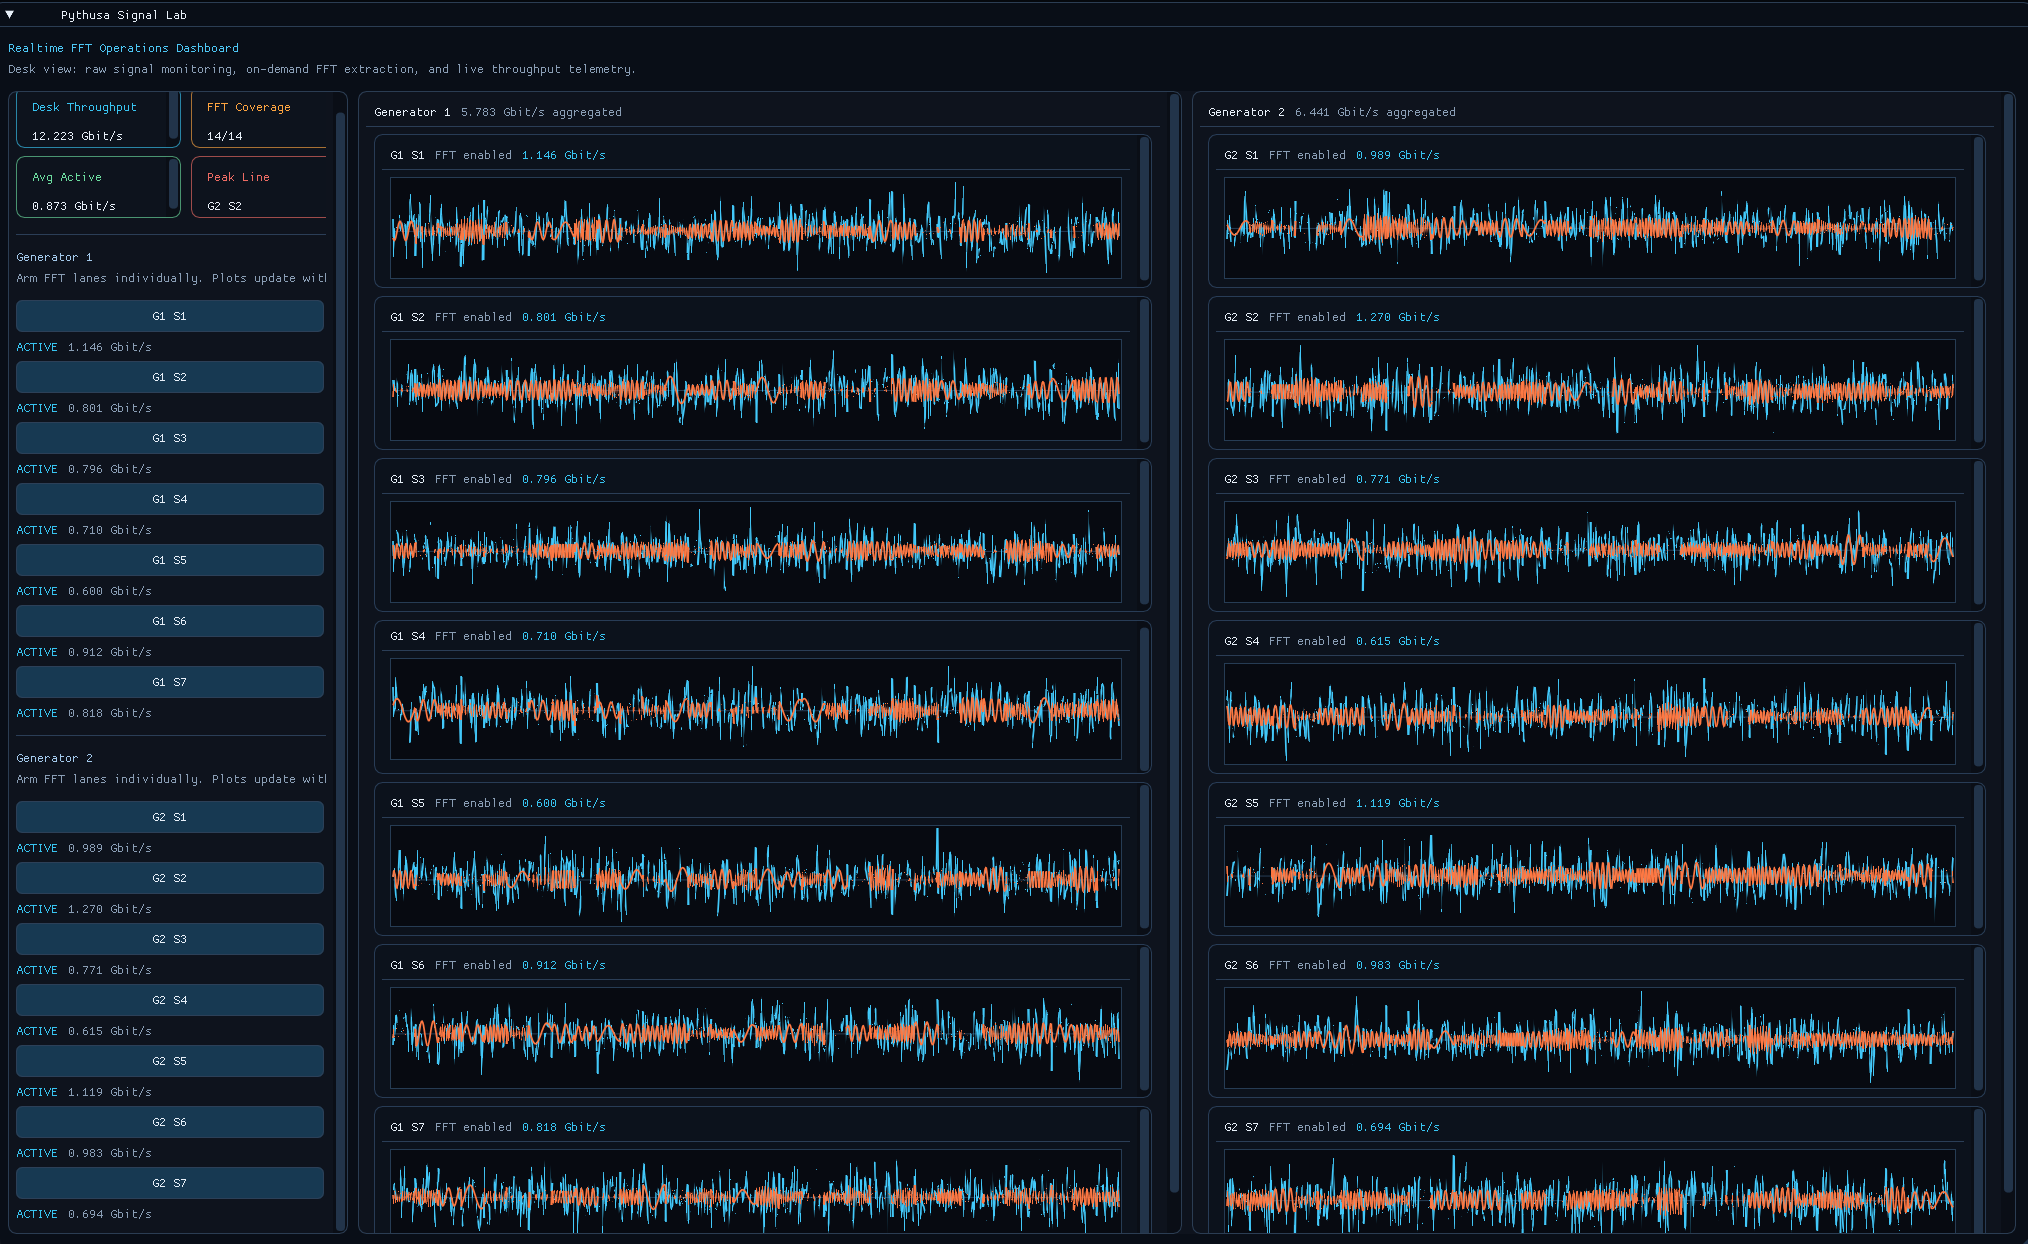 ImGui operator desk: live signal traces, on-demand FFT extraction, and per-channel throughput telemetry.
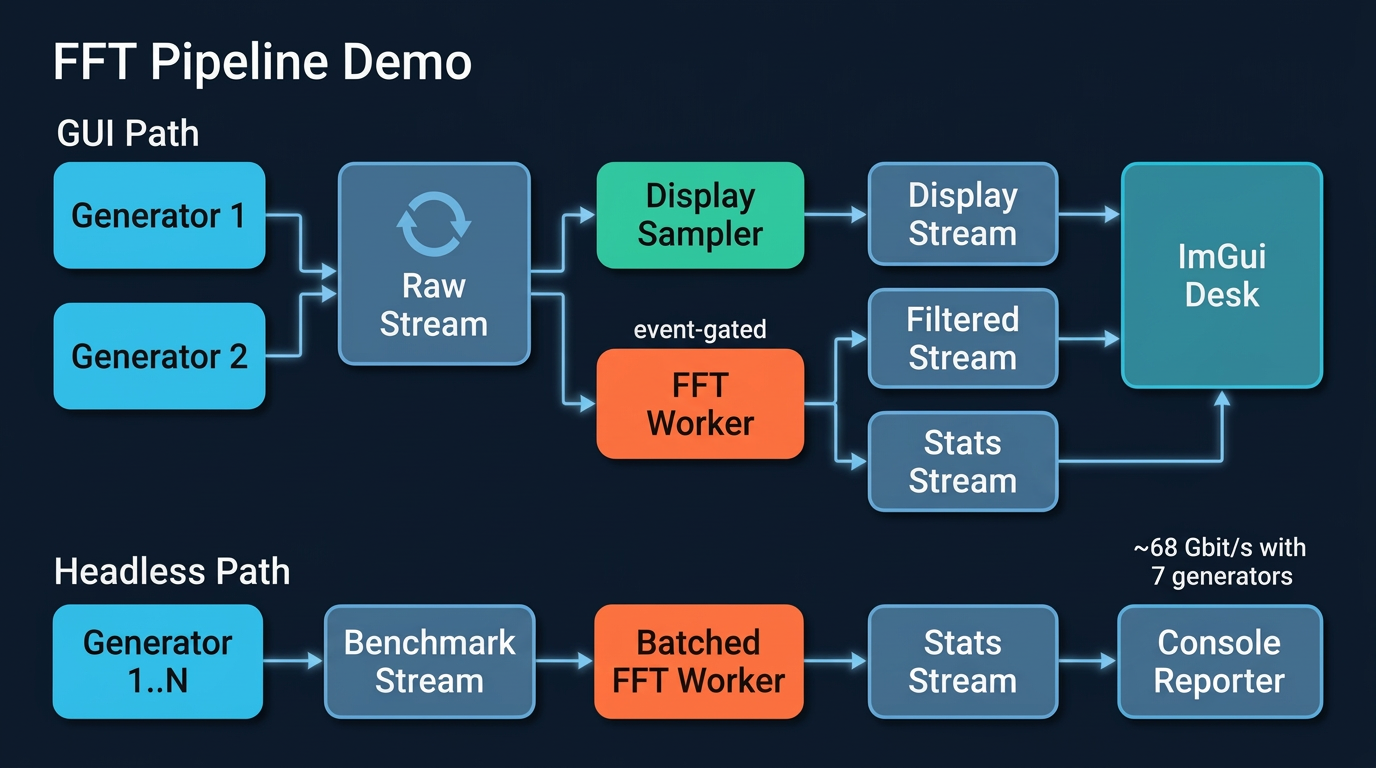
Architecture
Performance
| Mode | Generators | Signals | FFT window | Throughput | FFT rate |
|---|---|---|---|---|---|
throughput |
2 (default) | 14 | 8192 samples | ~21 Gbit/s | ~40k FFT/s |
throughput |
7 | 49 | 8192 samples | ~73 Gbit/s | ~140k FFT/s |
latency |
2 (default) | 14 | 1024 samples | ~5.8 Gbit/s | ~88k FFT/s |
Throughput is FFT input signal payload -- the data consumed by the analysis path, not total DRAM bandwidth or temporary array traffic. Scaling from 2 to 7 generators yields a 3.4x throughput increase by filling CPU headroom that the default configuration leaves unused.
What it exercises
- Zero-copy shared-memory streams -- data never gets pickled. Producers write frames into ring buffers; consumers read them through memoryviews.
- Pipeline DAG compilation -- validates topology at build time, catches missing bindings and cycles, topologically sorts task startup.
- Event-driven task gating -- FFT workers sleep until an operator arms them, then run continuously once signaled.
- Concurrent fanout -- the same generator stream feeds both the display path and the analysis path without duplicating data.
- Dynamic scaling --
--generators Nadds generator/FFT-worker pairs to fill available CPU headroom.
Signal shape
| Parameter | Value |
|---|---|
| Signals per generator | 7 |
| Sample rate | 61.44 kS/s per signal |
| Signal composition | 16 randomized sinusoids + Gaussian noise per channel |
Run
# GUI mode -- live dashboard with signal plots and FFT arm buttons
python examples/fft_pipeline_demo/main.py

# Headless throughput (default 2 generators, ~21 Gbit/s)
python examples/fft_pipeline_demo/main.py --headless --mode throughput --duration 10 --report-interval 1

# Scaled-up throughput (7 generators, ~73 Gbit/s)
python examples/fft_pipeline_demo/main.py --headless --mode throughput --generators 7 --duration 10 --report-interval 1

# Latency mode (1024-sample FFT window, ~88k FFT/s)
python examples/fft_pipeline_demo/main.py --headless --mode latency --duration 10 --report-interval 1
Each --generators N creates N data producers and N FFT consumers (plus one console reporter), so --generators 7 spawns 15 worker processes.
Flags
| Flag | Default | Purpose |
|---|---|---|
--headless / --no-gui |
off | Disable ImGui, print benchmark stats to stdout |
--mode |
throughput |
throughput (8192-row FFT) or latency (1024-row FFT) |
--generators N |
2 | Number of generator/FFT-worker pairs in headless mode |
--frame-rows N |
(from mode) | Override the FFT frame length for custom sweeps |
--duration SEC |
unlimited | Stop after a fixed interval |
--report-interval SEC |
1.0 | Print cadence in headless mode |
Stock Quant Demo
~50 Gbit/s aggregate market data throughput. 8 symbols. 9 live quant metrics per symbol. Pure Python.
A simulated L3 market microstructure replay desk that would normally require C++ or Java infrastructure. Eight parallel generators stream synthetic 3-level order-book snapshots and trade prints through shared-memory ring buffers into per-symbol quant analytics workers -- computing session returns, momentum, volatility, drawdown, depth imbalance, flow z-scores, microprice edge, VWAP deviation, and spread in real time with end-to-end latency tracking and speedup measurement against a serial baseline.
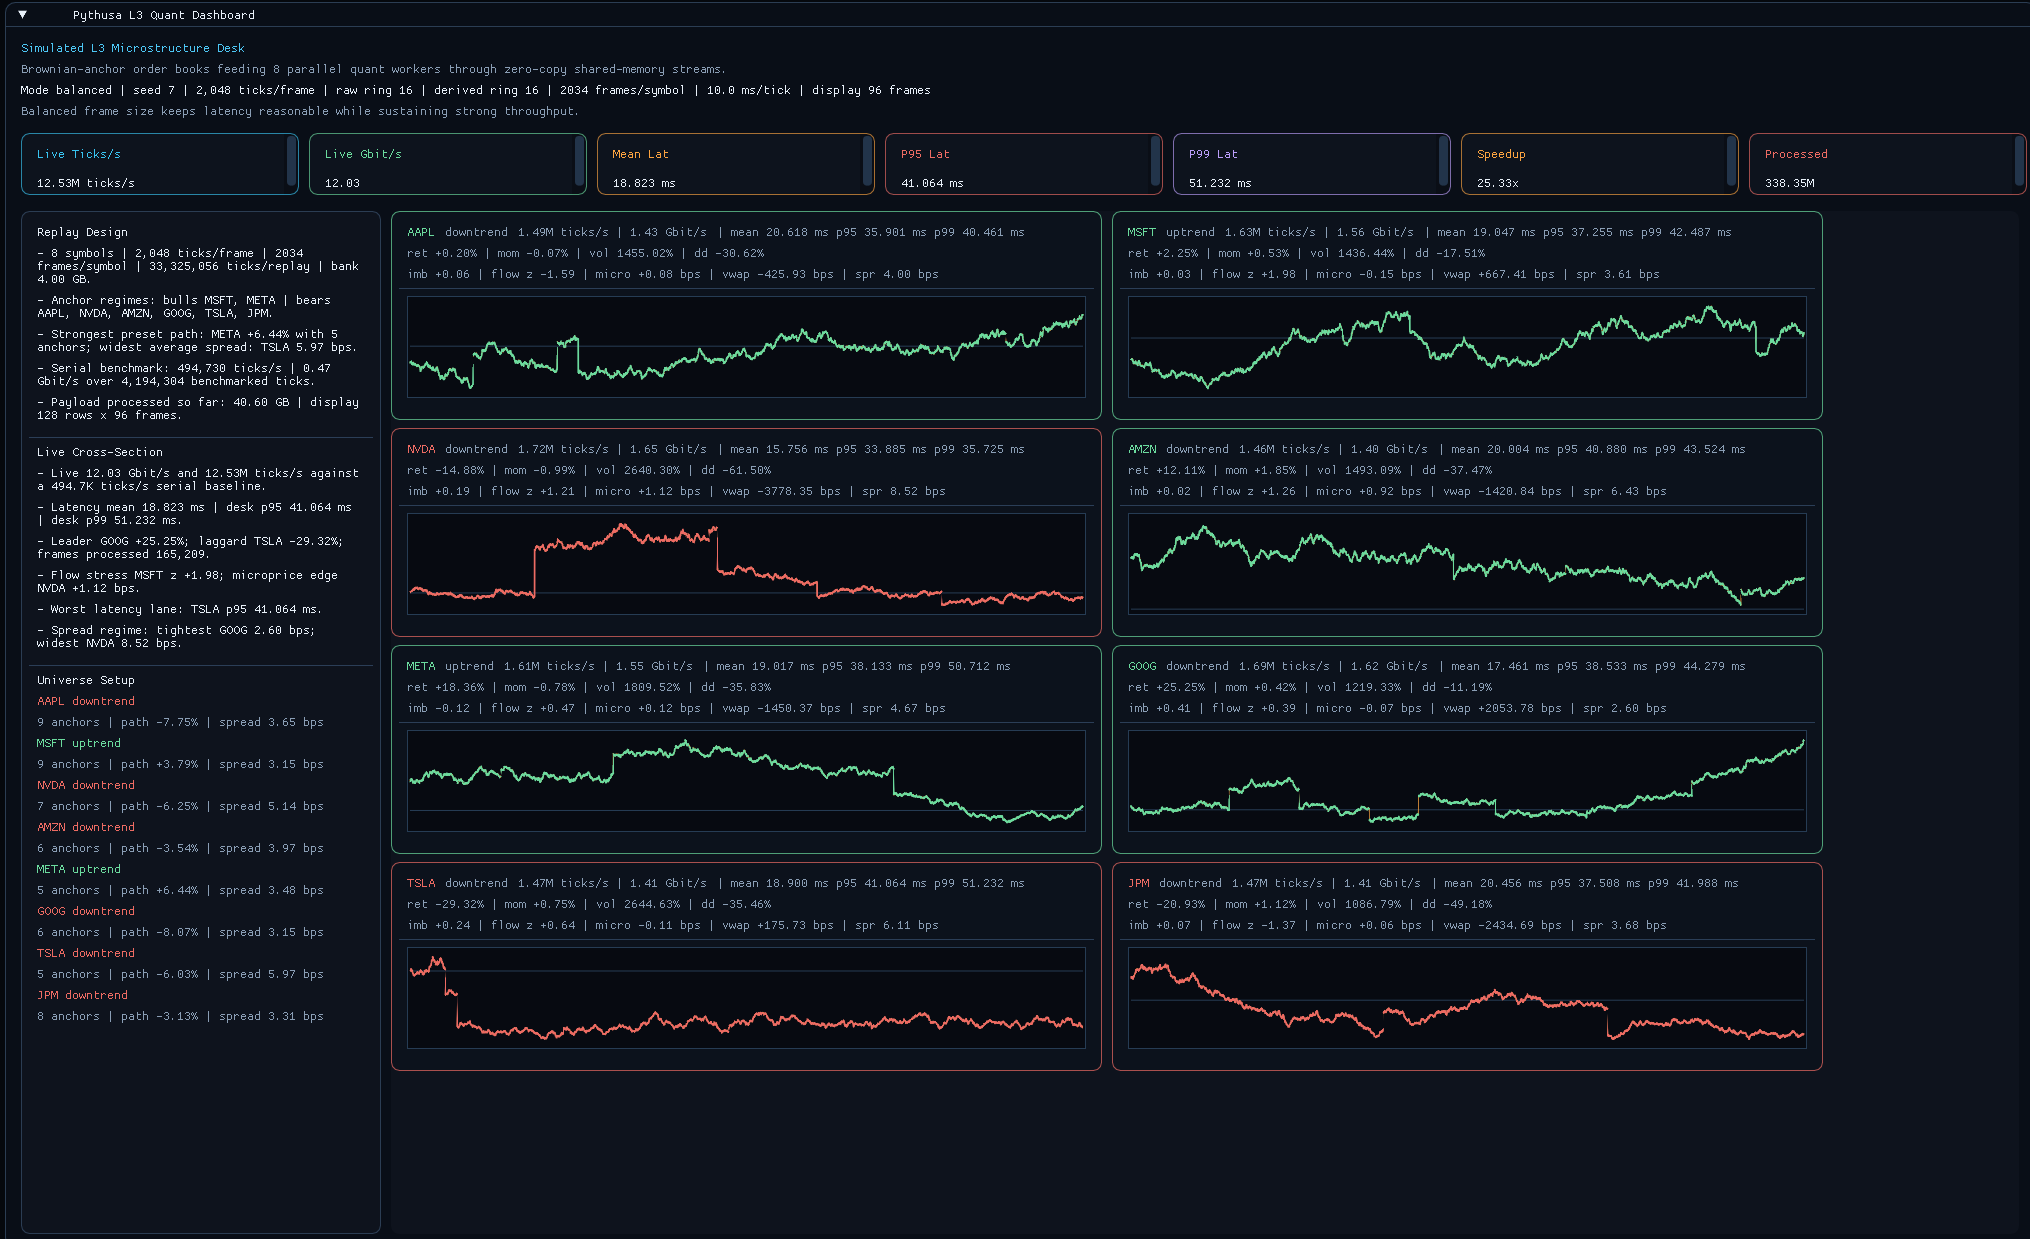 ImGui dashboard: 8-symbol cross-section with live midprice traces, EMA overlays, quant metric cards, and per-symbol throughput and latency.
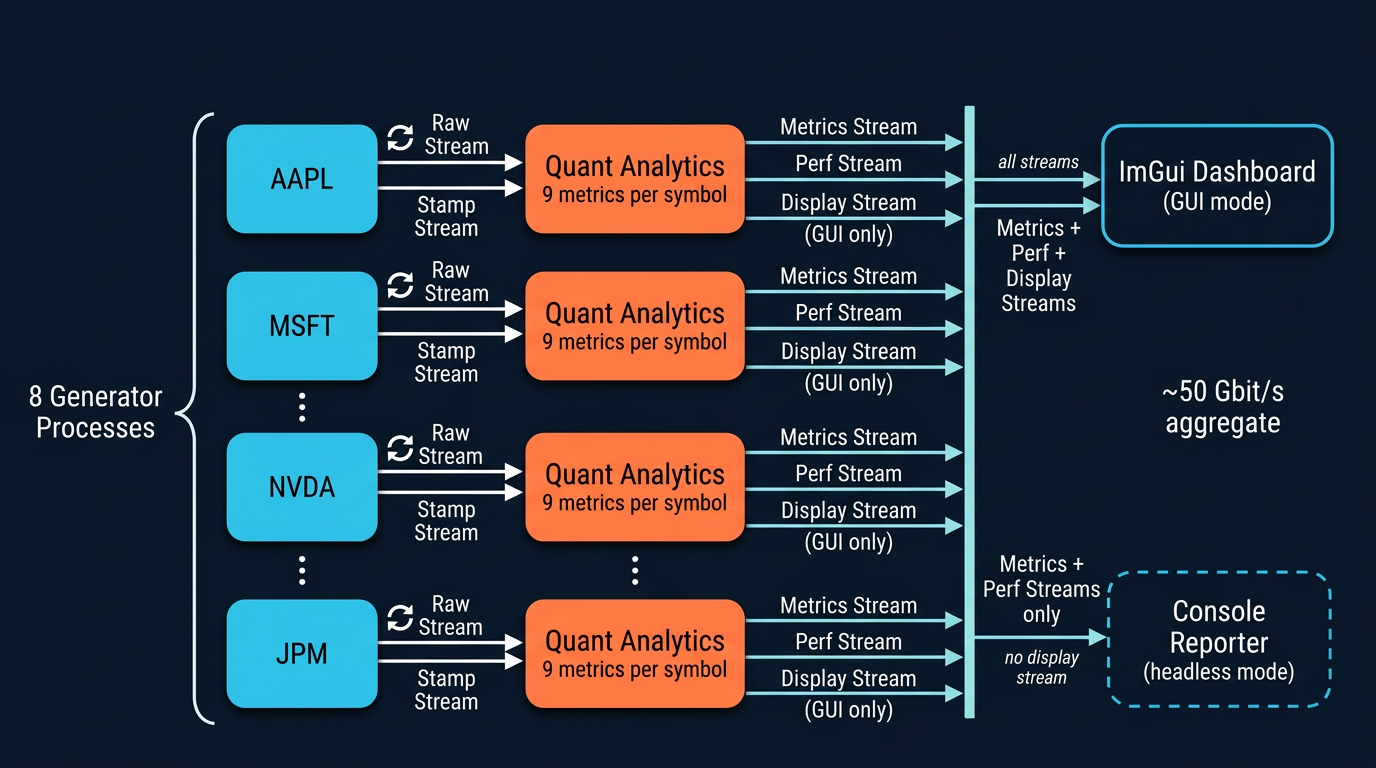
Architecture
Performance
| Profile | Throughput | Symbols | Metrics/symbol | Latency tracking |
|---|---|---|---|---|
throughput |
~50 Gbit/s | 8 | 9 | mean, p50, p95, p99 |
balanced |
moderate | 8 | 9 | mean, p50, p95, p99 |
latency |
lower | 8 | 9 | mean, p50, p95, p99 |
The pipeline reports aggregate ticks/s, Gbit/s payload, frame-latency percentiles, and parallel speedup against the serial baseline measured at startup.
What it exercises
- One generator process per symbol -- writes 3-level order-book snapshots and trade prints into shared-memory streams. No pickling, no serialization.
- One analytics process per symbol -- reads raw book data through zero-copy memoryviews and computes a full suite of microstructure metrics per frame.
- End-to-end latency tracking -- stamps each frame at publish and measures time to analytics completion (mean, p50, p95, p99).
- Speedup against a serial baseline -- runs the same quant math single-threaded at startup and reports the live parallel speedup factor.
- Runtime profiles -- tune the pipeline for latency, throughput, or a balanced default by adjusting frame size, ring depth, and report cadence.
Universe
| Symbol | Sector | Description |
|---|---|---|
| AAPL | Tech | Large-cap consumer electronics |
| MSFT | Tech | Large-cap enterprise software |
| NVDA | Semis | Large-cap GPUs and accelerators |
| AMZN | Tech | Large-cap e-commerce and cloud |
| META | Tech | Large-cap social media |
| GOOG | Tech | Large-cap search and cloud |
| TSLA | Auto | Large-cap electric vehicles |
| JPM | Finance | Large-cap investment bank |
Quant metrics
| Metric | What it measures |
|---|---|
| Session return | Cumulative return from the session anchor price |
| Momentum | Short-horizon return over a 256-tick window |
| Realized volatility | Annualized std-dev of log returns (512-tick window) |
| Drawdown | Decline from session peak midprice |
| Depth imbalance | (total bid - total ask) / total depth across 3 levels |
| Signed-flow z-score | Extremeness of latest signed trade notional vs. rolling window |
| Microprice edge | Size-weighted midprice deviation from simple midprice (bps) |
| VWAP deviation | Current midprice vs. session VWAP (bps) |
| Spread | Inside spread (bps) |
Runtime profiles
| Profile | Ticks/frame | Raw ring depth | Idle sleep | Best for |
|---|---|---|---|---|
latency |
256 | 4 frames | 10 us | Minimizing frame delay |
balanced |
2048 | 16 frames | 100 us | General interactive use |
throughput |
8192 | 32 frames | 200 us | Maximum aggregate payload |
Run
# GUI mode -- 960x600 dashboard with live cross-section
python examples/stock_quant_demo/main.py

# Headless throughput benchmark (~50 Gbit/s)
python examples/stock_quant_demo/main.py --headless --mode throughput --bank-gb 1 --duration 20 --report-interval 1

# Headless latency benchmark
python examples/stock_quant_demo/main.py --headless --mode latency --bank-gb 1 --duration 20 --report-interval 1
--bank-gb controls the precomputed replay bank size; smaller values (e.g. 1) reduce startup time while still saturating the pipeline.
Flags
| Flag | Default | Purpose |
|---|---|---|
--mode |
balanced |
Runtime profile: latency, balanced, or throughput |
--seed |
7 | Simulation RNG seed for reproducibility |
--bank-gb |
4.0 | Target total precomputed replay bank size in GB |
--headless |
off | Disable ImGui, print stats to stdout |
--duration |
unlimited | Stop after N seconds in headless mode |
--report-interval |
1.0 | Seconds between headless console reports |
More Examples
Beyond the showcase demos, examples/ includes smaller scripts that highlight specific PYTHUSA features:
python examples/basic_workers.py-- rawManagerplusSharedRingBufferusage.python examples/engine_dsp_pipeline.py-- largerPipelineexample with plotting, monitoring, and real DSP-style stages. Install.[examples]first.python examples/fir128_scaling_pipeline.py-- round-robin FIR128 fan-out/fan-in scaling example over engine-data-derived signals.
Want to see the code that makes this possible? Under the Hood -- a guided walkthrough of the ring buffer, zero-copy memoryviews, and cached backpressure that power these numbers.